initial-context extension
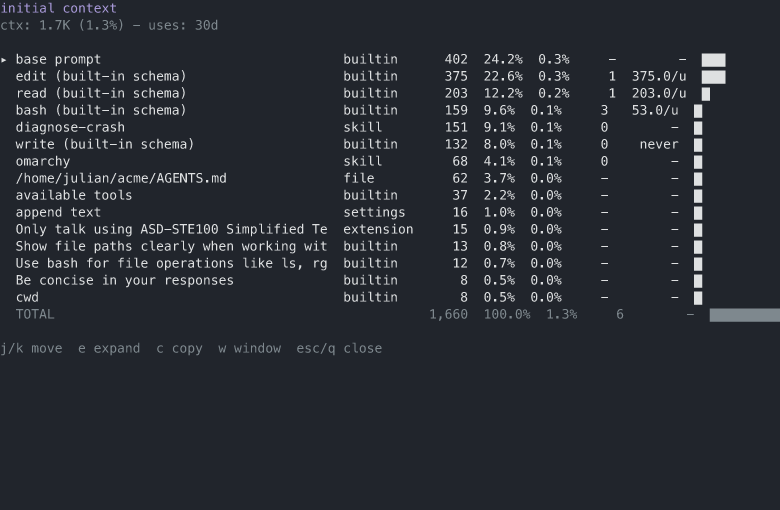
The token breakdown of the running agent's initial context: the system prompt and the tool definitions, which are resent to the model on every LLM call. One row per section and per tool, with token counts, percentages, and bars. Tool rows also show the tool's call count in a usage window (the last 30 days by default), so the cost of a tool can be weighed against how often it is used.
Screenshot
The /ctx view: one row per section and per tool - the base-prompt boilerplate, the available-tools snippet block, and one row per prompt guideline - with tokens, percentages of the context window, and the 30-day tool call counts.
/ctx (TUI)
Opens the breakdown. There is one row per part: the base-prompt region (ADR 0021), the append text, project instruction files, skills, the cwd line, a prompt injection when another extension touched the prompt, and each tool. Rows are sorted by size, largest first.
The default base prompt splits into report-sized rows. The base prompt row holds the boilerplate: the identity line, the custom-tools line, and the pi documentation block. The available tools row carries all the Prompt snippets (the one-line entries tools register). Each Prompt guideline gets its own row, attributed to its source: builtin for pi's default bullets, extension for the rest. A custom prompt stays a single row, as it has always been. The split changes presentation only: the section texts still concatenate to the exact base prompt, so the prompt injection detection and the token totals are unchanged.
Once the session has at least one provider request, a guideline whose text largely restates a sent tool description shows a duplicates tool description note, in the text table and the TUI (ADR 0022). The tool description is already resent on every call as part of the tool entry, so such a guideline pays cost without adding information. The check is deliberately conservative - it catches verbatim and prefixed-verbatim restatements, not paraphrases - and it compares against the descriptions of the last captured provider request, the text actually sent. Before the first provider request the rows show with no note, and the available-tools snippets are never flagged: the one-line restatement is the design of that section.
Every row shows its source (builtin, settings, file, skill, or extension; a tool is builtin or the extension that added it), its token count, its share of the initial context total, its share of the context window, and a bar. Tool rows additionally show their call count in the usage window. Skill rows show how often the agent loaded that skill's SKILL.md (a rough proxy: it counts the load, not the outcome). The other section rows show -, and TOTAL sums the tool calls.
With a usage view, a derived waste column appears (TUI and text): for a tool row with uses in the window it shows the cost a use pays (tokens per use), and for a tool row with zero uses it shows never, the mark that started the review of issue #72. The value is computed in the pure renderer from data the report already carries (the row's tokens and its call count); the usage scan and the window logic are untouched. Section rows and TOTAL show -.
The usage window is the last 30 days by default. w cycles 30d → 90d → all. In headless modes the command takes the window as an argument: /ctx 90d, /ctx all.
| Key | Action |
|---|---|
j / k | move the cursor (scroll the pane when expanded) |
e | expand the row to the exact text, or collapse |
c | copy the expanded row, or the whole breakdown |
w | cycle the usage window (30d, 90d, all) |
esc / q | close |
Expanding the mcp row lists its per-subtool split (mcp calls with a tool argument count as that subtool; connect, describe, and search count as plain mcp).
A footer status line keeps the total visible without opening the view: ctx: 45.2K (11.3%). The count is compact and uses the system locale's number format.
In headless modes the command prints the same breakdown as plain text: a notify record in RPC mode, the console in print mode.
How the numbers are built
The prompt rows come from the same structured inputs pi uses to build the system prompt (base template, append text, project files, skills, cwd). The base-template rows (boilerplate, snippets, guidelines) are the structured pieces of the default prompt, and their texts concatenate to the exact base prompt pi sends, which is what the injection detection compares against (ADR 0021). Tool rows come from the tool entries actually sent to the provider, captured read-only from the last provider request payload. Before the first call, built-in schemas are rebuilt from pi's exported tool factories and marked built-in schema; tools that cannot be resolved are listed by name with waiting for first call.
Token counts use pi's own estimator (chars / 4), so every row shares one consistent scale. The first assistant response also records the input tokens the provider reported, shown as a reference line. It is display only: the bar and percentages stay comparable across rows.
If other extensions append to the prompt, an injection row shows the suffix; anything else that changes the prompt is flagged modified by extension.
How the uses column is built
The counts are derived from the session files: a tool call is a toolCall item inside an assistant message, and a fork-copied line counts once (ADR 0009). A skill load is a tool call whose arguments reference the skill's SKILL.md, by path; the skill name is read off the directory that holds the file. The scan runs in the background on the first /ctx; the dialog shows a counting state until it settles. A scan that fails settles to an error state, and the next /ctx re-runs it. A per-file cache keyed on mtime and size (~/.pi/agent/tool-usage-cache.json, override PI_TOOL_USAGE_CACHE) makes every later open near instant and window switches a filter on cached events; the cache is a pure function of the session files, never a source of truth (ADR 0014). The sessions root is ~/.pi/agent/sessions, override PI_SESSIONS_DIR.
This extension registers no tools, no prompt text, and no prompt notes of its own, so its own overhead is zero.
Files
context.ts- pure core: row construction, payload parsing, injection detection, token estimation, plain-text renderingtool-usage.ts- the tool usage scan, cache, and windowstui.ts- the TUI viewindex.ts- event wiring and the/ctxcommand