usage extension
LLM token and cost reporting across all pi sessions: every .jsonl under ~/.pi/agent/sessions/, all working directories, including subagent sessions.
Screenshots
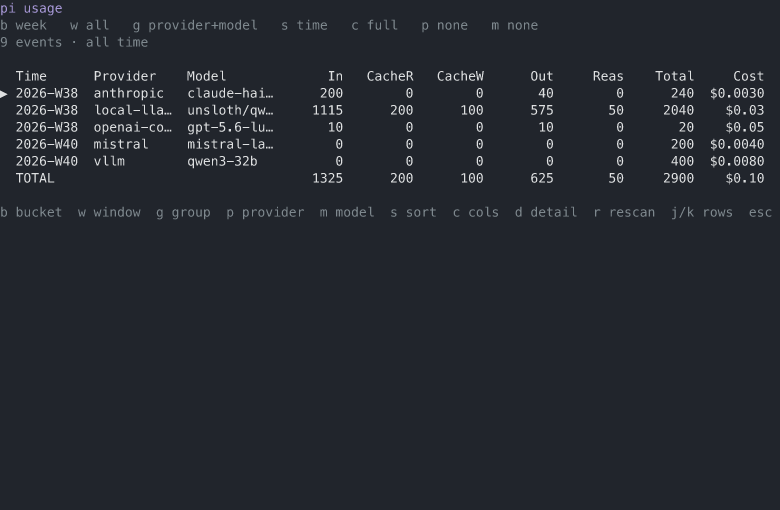
The TUI (/usage) over the fixture session files, all-time window:
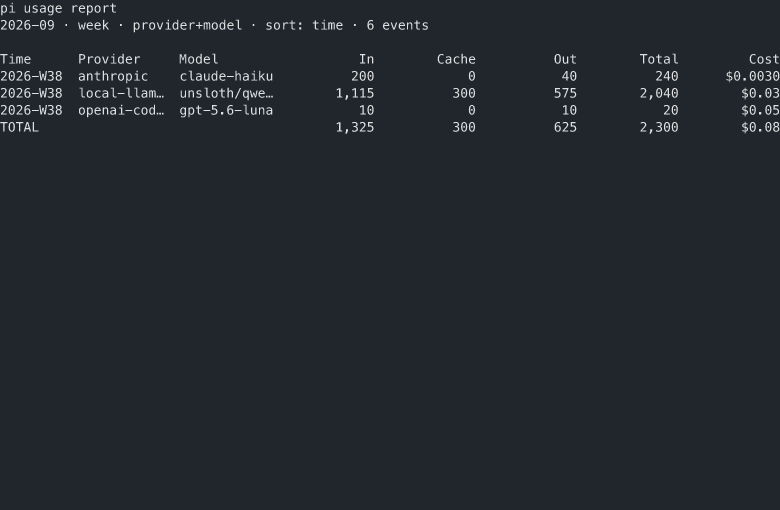
The CLI (pi-usage report --month 2026-09):
What is counted
A usage event is one recorded LLM call:
- an assistant message (its own provider and model)
- a tool result that did nested LLM work (no provider of its own)
- a compaction or branch summary (no provider of its own)
Forked and cloned sessions copy their ancestor's lines byte-identical, so each distinct line counts once (ADR 0009). Events without a provider are attributed to the model active at their position in the entry tree (ADR 0008). A partial trailing line in a live session is skipped. Zero-only events (aborted calls, unmeasured work) are dropped: they cannot change a total, and keeping them would render empty rows.
/usage (TUI)
Opens the interactive report. One scan on open, then all filtering happens in memory. Every knob is a key, and the legend at the bottom always shows them:
| Key | Knob | Values |
|---|---|---|
b | time bucket | day, week, month |
w | time window | 7d, 30d, 90d, 1y, all |
g | group by | provider+model, provider, model |
p | provider filter | cycles the providers, none |
m | model search | type a substring |
s | sort | time, tokens, cost |
c | columns | full, compact (cache merged) |
d / enter | detail | raw provider/model pairs under the row |
r | rescan | re-read the session files |
j / k | rows | move the cursor |
esc | close |
Defaults: last 30 days, week buckets, provider+model groups, sorted by time, a grand total row at the bottom.
Numbers are compact in the TUI: exact under 10,000, then k/M/B (a 12-digit count takes four columns). Exact digits live in the CLI and in --json.
In headless modes the command prints the same default report: a notify record in RPC mode, the console in print mode.
usage_report (agent tool)
With no arguments it queues /usage so the user gets the TUI. With arguments it returns the report as text:
bucket:day|week|monthwindow:7d|30d|90d|1y|allgroup:provider|model
pi-usage (CLI)
pi-usage report [--by day|week|month] [--by provider|model]
                [--since 7d|30d|90d|1y|all] [--month YYYY-MM] [--json]
pi-usage sessions
pi-usage help
Default report: last 30 days, week buckets, provider+model groups. --json emits rows with the raw provider/model pairs per row. sessions lists every session file with its totals (shared fork history is attributed to the first file scanned).
On a TTY narrower than 120 columns the report renders the compact column set (cache merged). Piped output always renders the full set.
Canonical identity
Grouping uses a Canonical identity: provider and model folded by a small rule table in lib/identity.ts.
llama.cpp,llama-server=http://127.0.0.1:8080, andcrossbar-llamacpp-127-0-0-1-8080are one provider:local-llamacppomnistays distinct: it is a remote provider with its own billing- model ids are lowercased, a trailing
:QUANTis stripped, and a-GGUFinfix is stripped, sounsloth/Qwen3.8-27B-GGUF:Q4_K_XLandunsloth/qwen3.8-27bare one line - any name no rule touches stays raw
The d key and --json expose the raw pairs behind each folded row.
Data path
The scan root is ~/.pi/agent/sessions/, overridable with the PI_SESSIONS_DIR environment variable (the tests use it to scan fixtures).